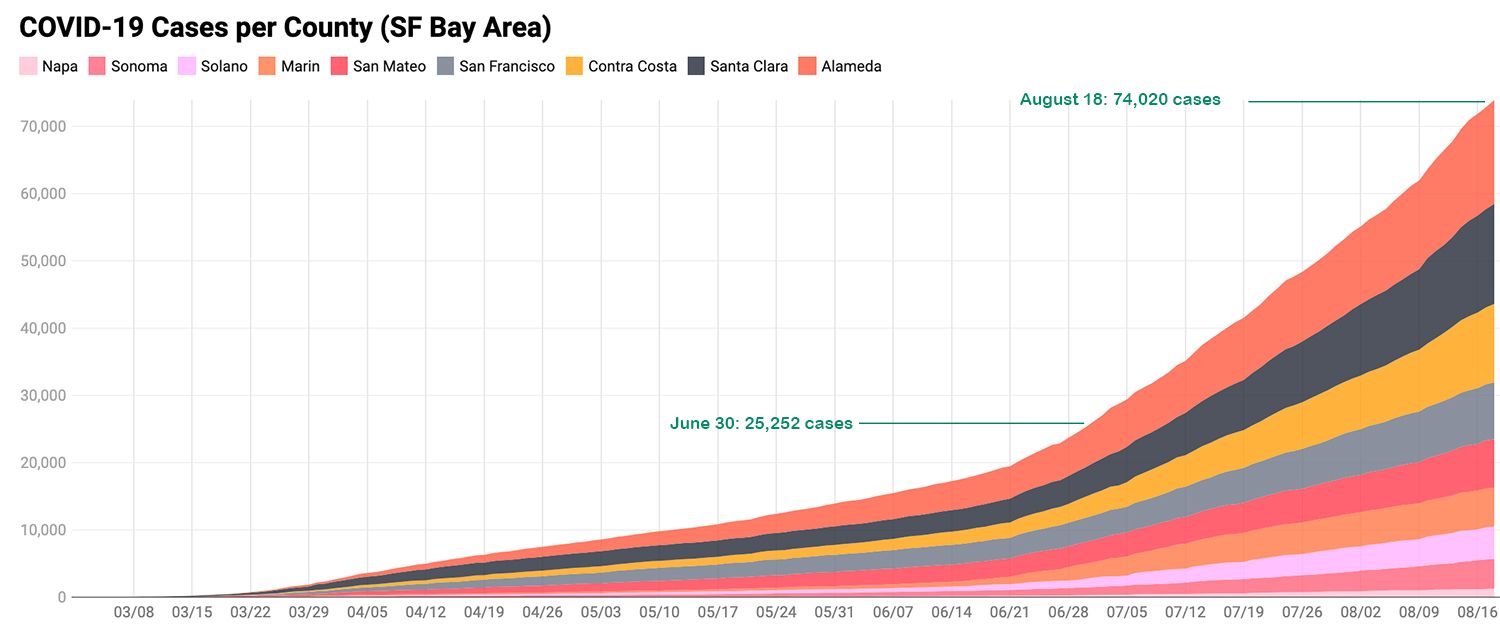
The mind-numbing daily updates about the coronavirus have become, at this point, a lot of noise to many people — even though there are actual human lives behind each number. Still, certain figures are striking when you look back at the data, especially now that the July surge that was seen across California appears to be abating somewhat.
"Overall, the state picture is stabilizing and coming down some," said CA Health and Human Services Secretary Mark Ghaly during a briefing on Tuesday. "Many counties across the state are doing things really well." Ghaly cited increased use of masks and better contact tracing for the slowing of new case rates.
San Francisco's cumulative COVID case count stands at 8,427 as of Tuesday, and the city has been adding an average of 105 new cases per day since July 31. But throughout the month of June, when the picture across the Bay Area and the state was looking better, SF was adding an average of only 35 new cases per days.
The Bay Area picture has been scarier, driven by wider surges seen last month in Alameda, Contra Costa, and Santa Clara counties, not to mention the San Quentin State Prison-driven surge in Marin County — though the case count outside the prison has risen steadily in Marin in the last six weeks as well.
On June 30, more than three months into the pandemic, the total number of COVID cases across the nine-county Bay Area was 25,252. But things quickly shifted in July after more people went back to work and more businesses opened — and as the virus made it into corners of the Bay Area where it perhaps hadn't reached yet. By July 31, just over four weeks later, the regional total had more than doubled to 53,205. And now, on August 18, just over six weeks later, the number has just about tripled to 74,000.

Going by weekly averages, the Bay Area was adding just under 1,600 new cases per week between early March and the end of June, and we've added an average of 7,000 new cases each week since July 1 — a quadrupling of the local rate of infection, at least based on confirmed tests.
Let's hope things are, indeed, stabilizing as Ghaly said today. From the beginning of the pandemic, looking at trends at the state level has not been very informative, just given how differently the virus has spread from region to region in the state. And over 40 of California's 58 counties remain on the state's watch list due to various metrics — though Santa Cruz and San Diego counties both dropped off the list in the last 48 hours.
At the state level, there were an average of 8,700 new cases recorded each day in the month of July. And since August 1, that average is down to around 7,600 cases per day, with a statewide cumulative total of just under 637,000 as of this writing.
Hospitalization rates have generally been trending downward over the last weeks, both at the state and local levels. However both the state and Bay Area hospitalization count ticked up on Tuesday.
There are currently around 857 seriously ill COVID-19 patients in Bay Area hospitals (with confirmed and suspected infections), with 111 of those in San Francisco as of Monday (including two transfers from other jurisdictions).

