Of course people all over the country like Donald Trump for a variety of misguided and ignorant reasons. But it's bizarre to know that in multiple corners of San Francisco, not only did Trump pick up new voters between 2016 and 2020, there were hundreds of SF residents who voted for him — despite everything.
The New York Times this week published some detailed, block-by-block maps that show vote tallies and percentages that went to Biden and Trump in cities all across the country. The San Francisco map is fascinating because while we mostly assume that any Democratic candidate is going to win in this city by a landslide, in an incredibly pivotal election that could have given Trump a second four-year term, many, many San Franciscans still voted for him.
Sure, Biden won most precincts here by huge margins — in much of the city, from Cole Valley to Bernal Heights to Mission Bay, Biden won with 85 to 95 percent of the vote. In some blocks of the Castro and the Haight it was 96 percent or higher. But on a couple of blocks on Steiner near Alamo Square, 35 percent of the vote went to Trump. And Trump took between 25 and 27 percent of the vote in certain segments of the Tenderloin, Chinatown, and the Sunset. In most cases this was a matter of a couple of hundred votes, but still.

It goes to show that even in extra-liberal San Francisco, there are plenty of people who — sometimes dozens or hundreds in a few blocks — who really don't agree with Democratic ideals, or who somehow saw Trump as an effective force in government.
SFist previously reported on the grand total of Trump voters in SF in 2020: 56,000. And that was a full 18,633 more people than voted for him here in 2016 — a full 10.75% of registered voters in the city, and 20,935 more votes than there are registered Republicans here.
But the latest data from the NYT gets more granular, and perhaps that makes it more creepy. Are there whole apartment buildings in the Tenderloin that went for Trump? Who are these people?
The comparison map that shows where Trump gained the most votes between 2016 and 2020 is a lot more strange, but it does jibe with the map above in many spots.
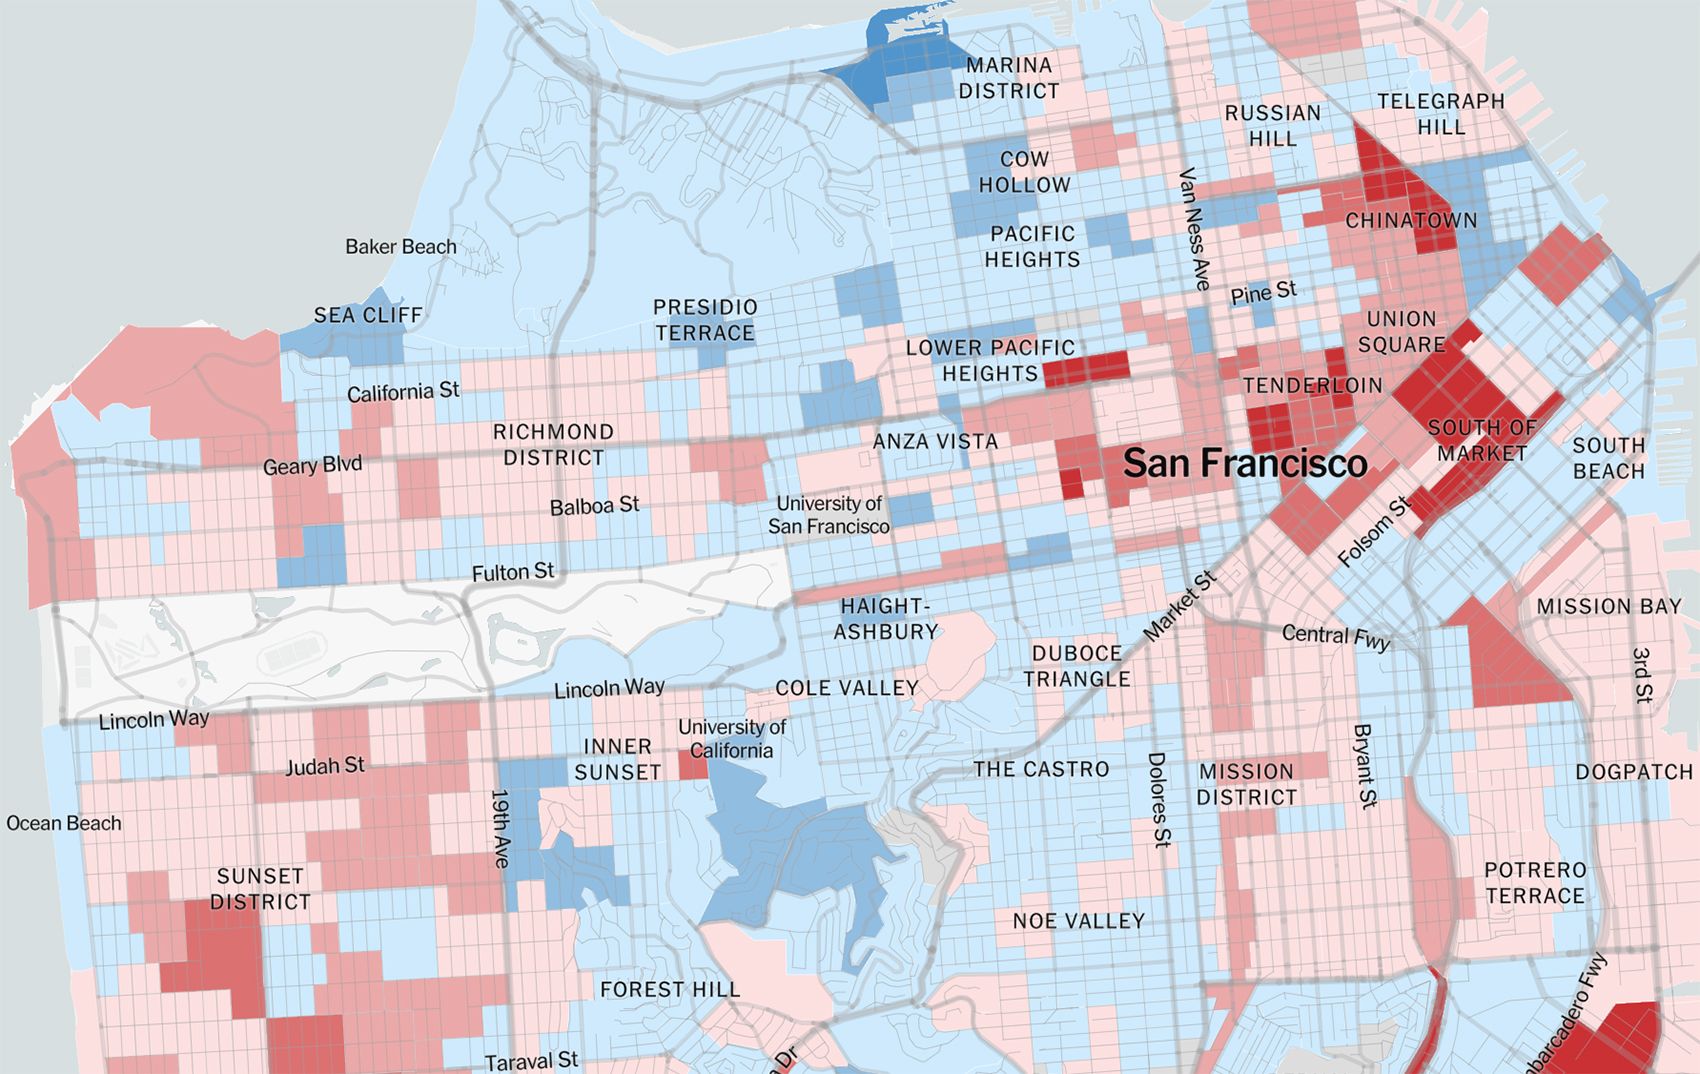
Those blocks near Alamo Square where Trump took 35% in 2020? They only went 24% for Trump in 2016. And in those areas of dark red in Chinatown, SoMa, and the Tenderloin, the percentage of Trump votes doubled in four years, from around 10% or 12% to around 20% or 25%.
Pink-shaded areas on the map show where Trump gained votes in single-digit percentages, and still, it's baffling. You would think, if anything, after four years of his nonsense, over racism, and insanity, those voters who thought he seemed like an amusing choice to try out in 2016 would largely be turned off and his vote totals would go down — especially in fucking San Francisco. But that's not what happened.
This is how dangerous it is to let a demagogue like him take power — because by achieving and holding power he gains more of it in the minds of those who supported him. Having been president for four years without burning the country down, all those who supported him and a few more begin to think he's actually effective. And everyone who believes the government is broken and nothing can fix it and takes a nihilist view of every election and votes for whoever promises to "drain the swamp" — which, by the way, Trump did not do by any stretch — is bound to vote for someone like him again.
And next time it could be so much worse.
Previously: Over 56,000 People in San Francisco Voted for Trump