While there are signs pointing to cases having already peaked in San Francisco in this dreadful Omicron wave, it should be noted that for the first time in the pandemic, San Francisco's daily average case rate per 100,000 residents has risen above that of Santa Clara and Alameda counties — and above any other in Northern California — for the first time in the pandemic.
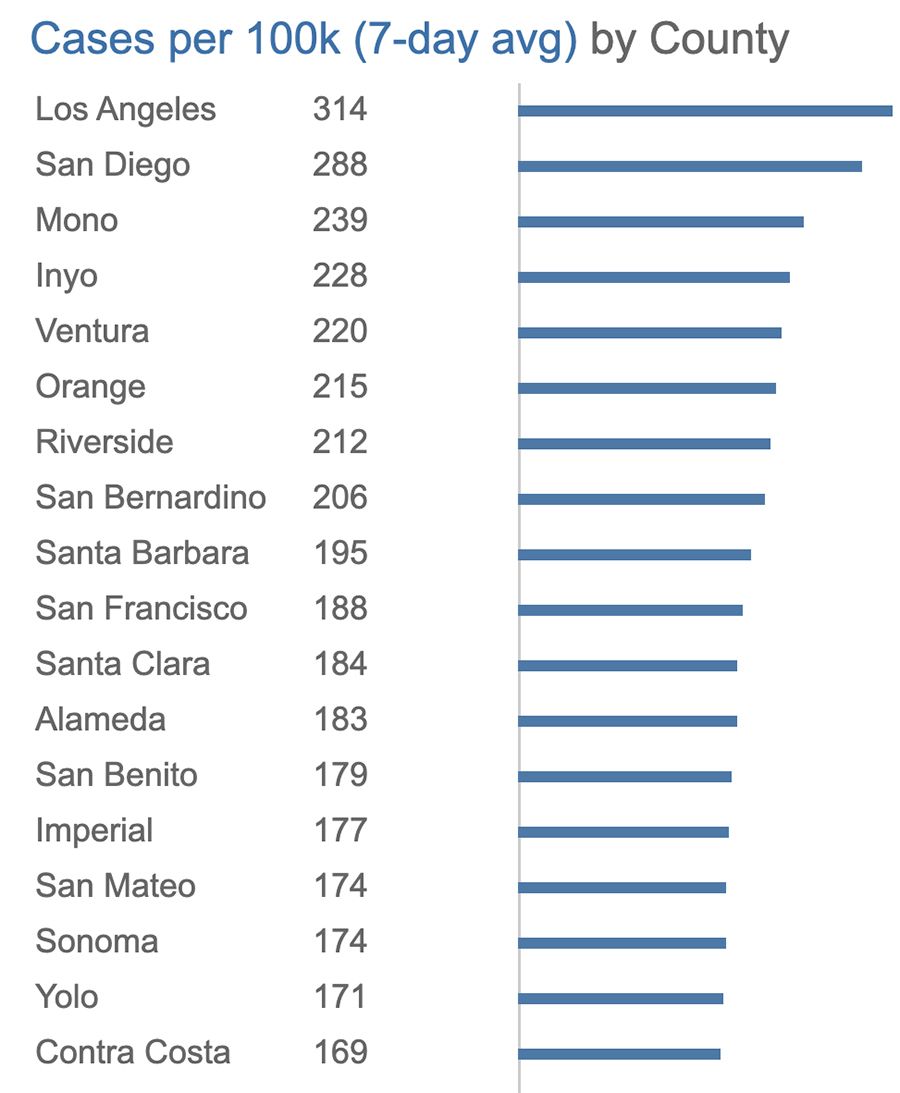
Maybe it's the fact that it's a dense city and people are still mostly going about their business as normal — albeit pretty well masked, except in bars — despite the highly infectious Omicron variant going around. Or maybe it's just that it's a dense city and lots of people traveled or partied over New Year's and gave each other the 'vid. But SF now has the distinction of having the highest per capita rate of new cases in the Bay Area, and in our half of the state — though it remains below the rates of seven large SoCal counties including Los Angeles and San Diego counties.
As of Thursday, according to data from the state, SF's seven-day average case rate per 100,000 residents was 188, while Santa Clara County's was 184, and Alameda County's was 183. This stands in contrast both to the higher case rates overall in those counties throughout the pandemic, and in contrast to SF's relatively low per-capita rates over the last 22 months.
By way of comparison, San Francisco County still ranks 15th in the state for cumulative cases in the pandemic — despite being the 12th most populous county, and the 4th most populous city in the state.

Case counts are still incomplete and unreliable for the last couple of days in San Francisco, however they appear to be arriving at a slower clip — and the city's seven-day average of new cases appears to have (possibly!) peaked on Monday (Jan. 10) at 1,687, reflecting samples taken before and after New Year's Eve. The highest single-day count of new cases to date, which was 2,717, was on January 9, reflecting samples taken about five days earlier. SF case counts have been coming down so far each day this week.

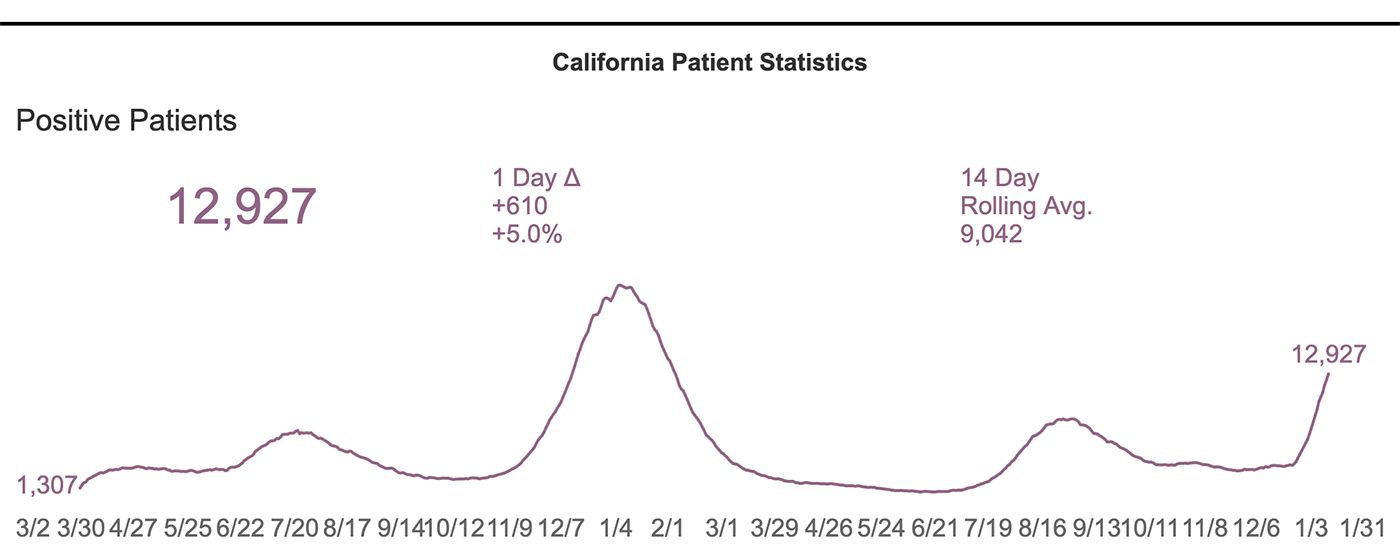
Hospitalizations across the state continue to rise, and will likely keep doing so — lagging a week or two behind still-rising case rates.
The picture, however, is not likely to be as grim as last January's, and will result in fewer deaths and likely fewer overall hospitalizations.
The statewide hospitalization graph shows no sign of a peak, but the number is still well below last January's surge.
It's now been two and a half weeks since San Francisco's daily case count started its rapid rise, hitting numbers not seen since last winter — and now eclipsing those numbers by far.
But, as we've been repeatedly told, this is the beginning of the endemic phase of COVID, and we must adjust — and get everyone boosted.
Related: SF Testing Sites Reopen; Buf If You Can't Find a Test, 'Assume It's COVID,' Says Local Expert
Photo: Getty Images