According to data from the San Francisco Department of Public Health (DPH), Bayview/Hunters Point continued to be a hot spot of COVID infection — and re-infection — in this summer's surge, and the highest concentrations of cases were in the southern part of the city overall.
By the official count, San Francisco saw around 22,000 new cases of COVID between May 31 and July 30 this year, driven by the highly infectious BA.5 variant. Some UCSF researchers have recently suggested that 80% of new COVID cases are going uncounted, due to general apathy and the prevalence of at-home testing, so that could mean that the true case count in SF is closer to 100,000 in the last two months.
Wastewater testing in mid-July suggested that this surge was, in fact, bigger than last winter's Omicron surge.
But with only the official PCR-test numbers to go by, we can still see a pattern of greater rates of infection in the city's less affluent neighborhoods. And in contrast with the initial Omicron surge in December and January, the Marina is no longer the hot spot it was — perhaps as a result of so much natural immunity from that surge, or just less PCR testing going on among those residents.
According to DPH's latest map of COVID cases, Bayview/Hunters Point saw 417 new cases per 10,000 residents in the last two months, Portola saw 370 new cases per 10,000 residents, and the Excelsior saw 352 cases per 10,000 residents. See the full interactive map here.

One exception in this surge was Mission Bay, which is populated with a lot of new condos and high-end rental units, and which came in third for the highest concentration of cases in June and July, with 369 cases per 10,000 residents.
At the other end of the spectrum, the Marina and Russian Hill had fewer than 150 new cases per 10,000 residents in those two months.
In total, 7% of cases since May 31 have been in Bayview/Hunters Point, and 25.6% of cases occurred in just a handful of southern neighborhoods.
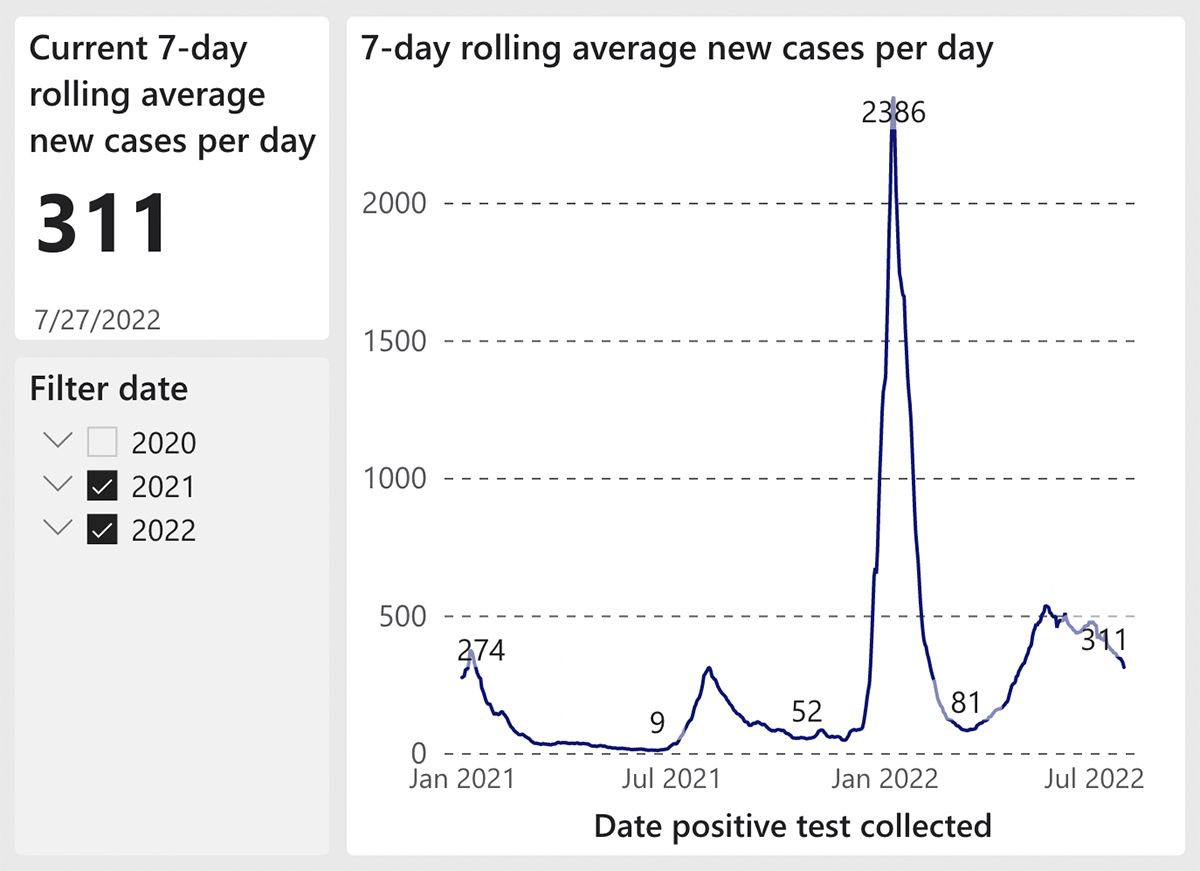
The surge appears to have peaked in San Francisco in late May and early June, with the seven-day average of new cases — at least by the official count — coming down fairly steadily since then. This is despite a lot of summer travel happening, and big events like SF Pride. The peak average of new cases was 537 on May 20, and that has dropped to 311 as of July 27.
These numbers are still a far cry from what we saw in November and early December of 2021, when the city was only recording 50 to 80 new cases per day — and those are hopefully what "endemic" numbers look more like.
Hospitalizations in the Bay Area, which, as in previous surges, have lagged behind the case counts by several weeks, hit a new peak on July 30 with 1,030 patients hospitalized — either with COVID or for COVID. Since this surge began in early May, around 400 Bay Area residents have died from COVID complications. Though it still may be too soon to say, that is around one-third of the death rate in the first Omicron surge, where we lost around 1,200 Bay Area residents to COVID between January 1 and March 31.
The total COVID death toll for our region stands at 8,820 as of Wednesday. 945 of those deaths have been among San Francisco residents.
Related: SF Bay Area Coronavirus Information & Graphs — Updated Daily